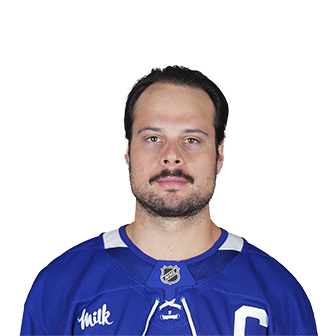
Auston Matthews Faceoff Stats
Auston Matthews has a career faceoff win percentage of 53.9% across 10,701 faceoffs. Best zone: Offensive (61.5%). Ranked #67 in the league.
Career FO%
53.9%
Record
5,770W - 4,931L
Total Faceoffs
10,701
League Rank
#67
Performance by Zone
Offensive Zone
61.5%
2,229 / 3,624 faceoffs
Defensive Zone
46.5%
1,596 / 3,431 faceoffs
Neutral Zone
53.3%
1,945 / 3,646 faceoffs
Situational Splits
Even Str.
54.1%
9,635 FO
Power Play
55.4%
574 FO
Pen. Kill
49.6%
492 FO
Home
56.2%
5,293 FO
Away
51.7%
5,408 FO
P1
55.4%
3,474 FO
P2
53.4%
3,581 FO
P3
52.8%
3,499 FO
OT
56.5%
147 FO
Final 5 min
54.0%
2,423 FO
vs Left
53.9%
6,827 FO
vs Right
54.0%
3,874 FO
Season-by-Season
| Season | Team | GP | FO% | W | Total FO | OZ% | DZ% | NZ% |
|---|---|---|---|---|---|---|---|---|
| 2026-27 | Toronto Maple Leafs | 24 | 54.5% | 213 | 391 | 70.6% | 44.5% | 48.9% |
| 2025-26 | Toronto Maple Leafs | 60 | 59.7% | 580 | 972 | 57.4% | 61.1% | 60.8% |
| 2024-25 | Toronto Maple Leafs | 67 | 56.8% | 695 | 1,223 | 52.5% | 62.7% | 55.4% |
| 2023-24 | Toronto Maple Leafs | 81 | 53.4% | 705 | 1,319 | 58.1% | 49.0% | 53.1% |
| 2022-23 | Toronto Maple Leafs | 74 | 52.4% | 550 | 1,049 | 65.3% | 37.6% | 53.2% |
| 2021-22 | Toronto Maple Leafs | 73 | 56.2% | 691 | 1,229 | 67.4% | 45.7% | 54.6% |
| 2020-21 | Toronto Maple Leafs | 52 | 51.9% | 450 | 867 | 56.9% | 46.6% | 52.3% |
| 2019-20 | Toronto Maple Leafs | 70 | 55.0% | 506 | 920 | 67.7% | 39.4% | 54.1% |
| 2018-19 | Toronto Maple Leafs | 68 | 52.1% | 475 | 911 | 61.1% | 43.3% | 51.5% |
| 2017-18 | Toronto Maple Leafs | 62 | 54.5% | 375 | 688 | 59.6% | 50.8% | 54.0% |
| 2016-17 | Toronto Maple Leafs | 81 | 46.8% | 530 | 1,132 | 65.9% | 26.3% | 47.6% |
Best Matchups
| Opponent | Record | Win% |
|---|---|---|
| vs. Pavel Buchnevich STL | 19-5 | 79.2% |
| vs. Nazem Kadri COL | 34-11 | 75.6% |
| vs. Brayden Schenn NYI | 33-13 | 71.7% |
| vs. Alexander Wennberg SJS | 41-18 | 69.5% |
| vs. Ryan Hartman MIN | 29-13 | 69.0% |
| vs. Nick Schmaltz UTA | 24-11 | 68.6% |
| vs. Ryan Strome CGY | 30-14 | 68.2% |
| vs. Yanni Gourde TBL | 32-15 | 68.1% |
| vs. Sam Reinhart FLA | 18-9 | 66.7% |
| vs. Jack Hughes NJD | 18-9 | 66.7% |
Toughest Matchups
| Opponent | Record | Win% |
|---|---|---|
| vs. Travis Zajac NJD | 8-19 | 29.6% |
| vs. Patrice Bergeron BOS | 25-48 | 34.2% |
| vs. Jonathan Toews WPG | 17-31 | 35.4% |
| vs. Jay Beagle ARI | 11-20 | 35.5% |
| vs. Derek MacKenzie FLA | 9-16 | 36.0% |
| vs. Nick Paul TOR | 21-35 | 37.5% |
| vs. Joe Veleno NYR | 9-15 | 37.5% |
| vs. Joe Pavelski DAL | 8-13 | 38.1% |
| vs. Bryan Little WPG | 8-13 | 38.1% |
| vs. Henrik Zetterberg DET | 17-27 | 38.6% |
Similar Players
| Player | Team | FO% | Total FO | Similarity |
|---|---|---|---|---|
| Matt Duchene vs | COL, NSH, DAL, OTT, CBJ | 54.1% | 12,680 | 99.5% |
| Jason Spezza vs | DAL, OTT, TOR | 54.7% | 10,398 | 99.3% |
| Jonathan Toews vs | CHI, WPG | 58.0% | 18,297 | 99.2% |
| Ryan Johansen vs | NSH, CBJ, COL | 53.4% | 14,159 | 98.8% |
| J.T. Miller vs | NYR, VAN, TBL | 55.1% | 9,382 | 98.8% |
| Martin Hanzal vs | PHX, ARI, DAL, MIN | 53.7% | 7,391 | 98.7% |
| Patrice Bergeron vs | BOS | 59.2% | 19,958 | 98.5% |
| Joe Thornton vs | SJS, FLA, TOR | 54.3% | 8,490 | 98.2% |
| Joe Pavelski vs | SJS, DAL | 54.2% | 12,074 | 98.2% |
| Pavel Datsyuk vs | DET | 54.5% | 5,994 | 98.1% |