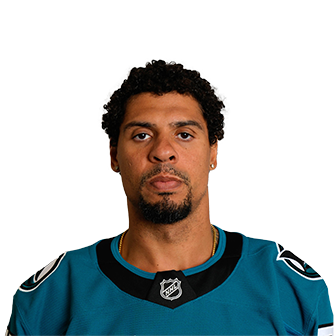
Ryan Reaves Faceoff Stats
2025-262024-252023-242022-232021-222020-212019-202018-192017-182016-172015-162013-142012-132011-122010-11
All Seasons
Ryan Reaves has a 2019-20 faceoff win percentage of 46.2% across 52 faceoffs in the 2019-20 season. Best zone: Offensive (88.2%).
2019-20 FO%
46.2%
Record
24W - 28L
Total Faceoffs
52
Total Faceoffs
52
Performance by Zone
Offensive Zone
88.2%
15 / 17 faceoffs
Defensive Zone
8.7%
2 / 23 faceoffs
Neutral Zone
58.3%
7 / 12 faceoffs
Situational Splits
Even Str.
46.5%
43 FO
Power Play
37.5%
8 FO
Pen. Kill
100.0%
1 FO
Home
55.6%
27 FO
Away
36.0%
25 FO
P1
41.7%
12 FO
P2
50.0%
26 FO
P3
42.9%
14 FO
Final 5 min
25.0%
8 FO
vs Left
46.2%
39 FO
vs Right
46.2%
13 FO
Season-by-Season
| Season | Team | GP | FO% | W | Total FO | OZ% | DZ% | NZ% |
|---|---|---|---|---|---|---|---|---|
| 2025-26 | San Jose Sharks | 2 | 0.0% | 0 | 2 | 0.0% | 0.0% | 0.0% |
| 2024-25 | Toronto Maple Leafs | 1 | 0.0% | 0 | 1 | 0.0% | 0.0% | 0.0% |
| 2023-24 | Toronto Maple Leafs | 1 | 100.0% | 1 | 1 | 0.0% | 0.0% | 100.0% |
| 2022-23 | Minnesota Wild, New York Rangers | 12 | 26.7% | 4 | 15 | 28.6% | 20.0% | 33.3% |
| 2021-22 | New York Rangers | 8 | 50.0% | 5 | 10 | 50.0% | 33.3% | 66.7% |
| 2020-21 | Vegas Golden Knights | 9 | 30.8% | 4 | 13 | 33.3% | 40.0% | 20.0% |
| 2019-20 | Vegas Golden Knights | 39 | 46.2% | 24 | 52 | 88.2% | 8.7% | 58.3% |
| 2018-19 | Vegas Golden Knights | 46 | 42.6% | 40 | 94 | 77.1% | 15.0% | 36.8% |
| 2017-18 | Pittsburgh Penguins, Vegas Golden Knights | 20 | 50.0% | 14 | 28 | 60.0% | 18.2% | 85.7% |
| 2016-17 | St. Louis Blues | 5 | 0.0% | 0 | 5 | 0.0% | 0.0% | 0.0% |
| 2015-16 | St. Louis Blues | 2 | 50.0% | 1 | 2 | 100.0% | 0.0% | 0.0% |
| 2013-14 | St. Louis Blues | 8 | 75.0% | 6 | 8 | 80.0% | 50.0% | 100.0% |
| 2012-13 | St. Louis Blues | 2 | 100.0% | 3 | 3 | 0.0% | 100.0% | 100.0% |
| 2011-12 | St. Louis Blues | 2 | 50.0% | 1 | 2 | 100.0% | 0.0% | 0.0% |
| 2010-11 | St. Louis Blues | 2 | 0.0% | 0 | 2 | 0.0% | 0.0% | 0.0% |
Best Matchups
Not enough data
Toughest Matchups
Not enough data
Similar Players
| Player | Team | FO% | Total FO | Similarity |
|---|---|---|---|---|
| Brendan Gallagher vs | MTL, VAN | 42.4% | 769 | 82.1% |
| Brett Connolly vs | TBL, WSH, FLA, BOS, CHI | 40.8% | 289 | 80.1% |
| Jonathan Huberdeau vs | FLA, CGY | 40.6% | 399 | 79.6% |
| Frank Vatrano vs | FLA, ANA, BOS, NYR | 38.2% | 251 | 77.1% |
| Mats Zuccarello vs | MIN, NYR, LAK | 38.5% | 530 | 76.7% |
| Jonathan Marchessault vs | VGK, NSH, FLA, TBL | 41.9% | 1,729 | 76.5% |
| Nick Schmaltz vs | ARI, UTA, CHI | 42.7% | 4,525 | 76.4% |
| Connor Zary vs | CGY | 41.2% | 519 | 74.5% |
| Travis Konecny vs | PHI | 40.7% | 467 | 74.3% |
| Berkly Catton vs | SEA | 45.2% | 330 | 73.5% |